
Key Points
- The article introduced the concept and purpose of cluster analysis in data mining in a simple way
- The article explained the main types and methods of cluster analysis with examples and advantages and disadvantages
- The article provided examples and applications of cluster analysis in different domains, such as marketing, business operations, image analysis, and biology.
- The article showed how to use RStudio, a popular data analysis tool, to perform cluster analysis with code and visualization.
- The article provided links and resources for further learning and invited feedback from the readers.

I'm Zubair Goraya, a certified data analyst and RStudio Expert. In this article, I will show you how to perform cluster analysis in data mining using RStudio.
Cluster analysis is a powerful technique for discovering hidden patterns and insights in your data. But what is cluster analysis exactly, and how can you use it for data mining? Let's find out!
What is Cluster Analysis?
Cluster analysis is a data analysis method that groups similar objects based on some criteria. For example, you can cluster customers based on their demographics, preferences, or behavior. The goal of cluster analysis is to identify meaningful and homogeneous groups of objects that share some common characteristics.
Cluster analysis, also known as clustering, data clustering, or cluster mining, is one of the most popular data mining methods. It extracts useful information from large and complex data sets.
Why Cluster Analysis?
Cluster analysis can help you with many tasks, such as:
- Exploratory data analysis: You can use cluster analysis to explore your data and determine its structure. You can also use it to detect outliers or anomalies that deviate from standard patterns.
- Data reduction: You can use cluster analysis to reduce the dimensionality of your data by grouping similar objects into clusters. This can make your data easier to understand and visualize.
- Data segmentation: You can use cluster analysis to segment your data into meaningful groups based on some criteria. This can help you target different segments with different strategies or actions.
- Data modeling: You can use cluster analysis to create models that describe the relationships between the clusters and the variables. This can help you make predictions or recommendations based on the cluster characteristics.
How Cluster Analysis Works?
Cluster analysis works by applying a clustering algorithm to your data. A clustering algorithm is a set of rules or steps determining how to assign objects to clusters. There are many types of clustering algorithms, but they can be broadly classified into three categories:
- Partitioning methods divide the data into a predefined number of clusters, such as k-means or k-medoids. They try to minimize the distance between the objects within each group and maximize the distance between the clusters.
- Hierarchical methods: These methods create a hierarchy of clusters, such as agglomerative or divisive methods. They start with either one cluster containing all the objects or one cluster for each object and then merge or split clusters until a desired level of granularity is reached.
- Density-based methods: These methods identify clusters based on the density of the objects in the data space, such as DBSCAN or OPTICS. They try to find regions where the objects are densely packed and separate them from regions where they are sparsely distributed.
How to Choose a Clustering Algorithm?
This question has no definitive answer, as different clustering algorithms may suit different data types and objectives. However, here are some factors that you should consider when choosing a clustering algorithm:
The shape and size of the clusters
Some algorithms assume that the clusters are spherical or convex, while others can handle arbitrary shapes and sizes. For example, k-means may not work well for elongated or overlapping clusters, while DBSCAN may be able to detect them.
The number of clusters
Some algorithms require you to specify the number of clusters in advance, while others can determine it automatically based on the data. For example, k-means needs you to provide the value of k (the number of clusters), while DBSCAN can find the optimal number of clusters based on the density parameter.
The scalability and efficiency of the algorithm
Some algorithms are faster and more scalable than others, especially for large and high-dimensional data sets. For example, k-means is relatively simple and efficient, while hierarchical methods are more complex and computationally intensive.
The validity and evaluation of the clusters
Some algorithms provide measures or criteria to evaluate the quality and validity of the clusters, while others do not. For example, k-means uses the sum of squared errors (SSE) to measure cluster compactness, while DBSCAN does not have a clear objective function.
How to Perform Cluster Analysis in RStudio?
RStudio is a powerful tool for data analysis and visualization. It supports many packages and functions for cluster analysis in data mining. Here are some steps that you can follow to perform cluster analysis in RStudio:
Load your data into RStudio
You can use the read.csv() function to read a CSV file or the read.table() function to read a text file. You can also use the data() function to load some built-in data sets, such as iris or mtcars.
Preprocess your data
You may need to clean, transform, or normalize your data before applying a clustering algorithm. You can use the dplyr package to manipulate your data or the scale() function to standardize your data.
Choose a clustering algorithm and apply it to your data
You can use the cluster package to access many clustering algorithms, such as means () for k-means, pam() for k-medoids, Agnes () for agglomerative hierarchical clustering, or dbscan() for DBSCAN. You can also use the NbClust() function from the NbClust package to determine the optimal number of clusters for your data.
Visualize your clusters
You can use the ggplot2 package to create beautiful plots of your clusters, such as scatter plots, dendrograms, or silhouette plots. You can also use the factoextra package to simplify the visualization process with functions such as fviz_cluster().
Interpret and evaluate your clusters
The broom package can extract information from your clustering results, such as cluster labels, cluster centers, or cluster sizes. You can also use the clusterCrit package to compute various cluster validity indices, such as the Dunn, Calinski-Harabasz, or Silhouette index.
Cluster Analysis Example in RStudio
To illustrate how to perform cluster analysis in RStudio, let's use the famous iris data set. This data set contains 150 observations of three species of iris flowers: setosa, Versicolor, and virginica. Each observation has four measurements: sepal length, sepal width, petal length, and petal width.
Let's see if we can cluster the iris flowers using k-means and DBSCAN algorithms based on their measurements.
Load the data
The iris data set is built-in in RStudio, so we can load it using the data() function:
# Load the iris data set
data(iris)
# View the first six rows of the data
head(iris)
str(iris)
At the end of the blog post you can run this code and explore the output
We can see that the data has five columns: four numeric columns for the measurements and one-factor column for the species.
Preprocess the data
Before applying a clustering algorithm, we need to preprocess the data by removing the species column and scaling the numeric columns:
# Remove the species column
# Remove the species column
iris <- -5="" columns="" iris="" numeric="" pre="" scale="" the="">
At the end of the blog post you can run this code and explore the output
Choose and apply a clustering algorithm
Let's start with the k-means algorithm and see how it performs on our data. We need to specify the number of clusters (k) for the k-means algorithm.
Elbow method
The elbow method is one way to determine the optimal number of clusters. The elbow method plots the sum of squared errors (SSE) against different values of k and looks for a point where the SSE curve bends or forms an elbow.
We can use a loop to compute the SSE for different values of k and plot them using ggplot2:
# Load ggplot2 package
# Load ggplot2 package
library(ggplot2)
# Create an empty vector to store SSE values
sse <- 10="" 1:10="" 1="" a="" aes="" against="" algorithm="" and="" append="" apply="" c="" centers="k)" clusters="" create="" data.frame="" data="" different="" elbow="" for="" frame="" from="" geom_line="" geom_point="" ggplot2="" ggplot="" in="" iris="" k-means="" k="" km="" kmeans="" labs="" loop="" of="" over="" plot="" pre="" sse="" title="Elbow method for k-means" to="" tot.within="" using="" value="" values="" vector="" with="" x="Number of clusters" y="Sum of squared errors">
At the end of the blog post you can run this code and explore the output
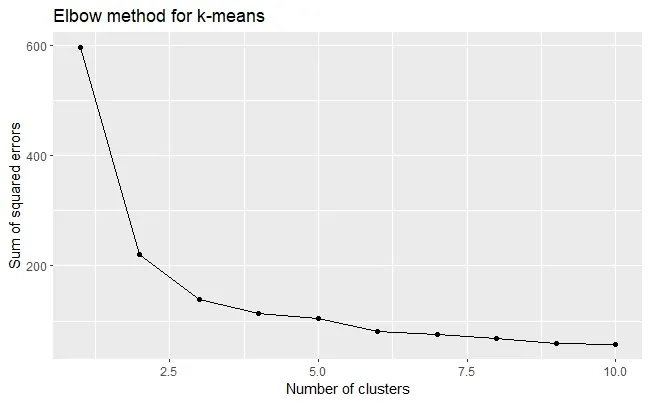
We can see that the SSE curve bends at k = 3, which suggests that 3 is the optimal number of clusters for our data.
K-means algorithm
Let's apply the k-means algorithm with k = 3 and see the results:
# Apply k-means algorithm with k = 3
km <- centers="3)" cluster="" iris="" km="" kmeans="" labels="" pre="" the="" view="">
At the end of the blog post you can run this code and explore the output
We can see that the algorithm has assigned each observation to one of the three clusters. We can also view the cluster centers, which are the mean values of each variable for each cluster:
# View the cluster centers
km$centers
We can see that the clusters differ in their mean values for each variable. For example, cluster 3 has the highest mean values for petal length and petal width, while cluster 1 has the lowest mean values for sepal width and petal length.
Visualize the clusters
We can use the fviz_cluster() function from the factoextra package to visualize the clusters. This function creates a scatter plot of the clusters using principal component analysis (PCA) to reduce the dimensionality of the data. We can also add some color and labels to make the plot more informative:
# Load factoextra package
library(factoextra)
# Create a scatter plot of the clusters using PCA
fviz_cluster(km, data = iris) +
 labs(title = "K-means clustering of iris data") +
 theme_minimal()
At the end of the blog post you can run this code and explore the output
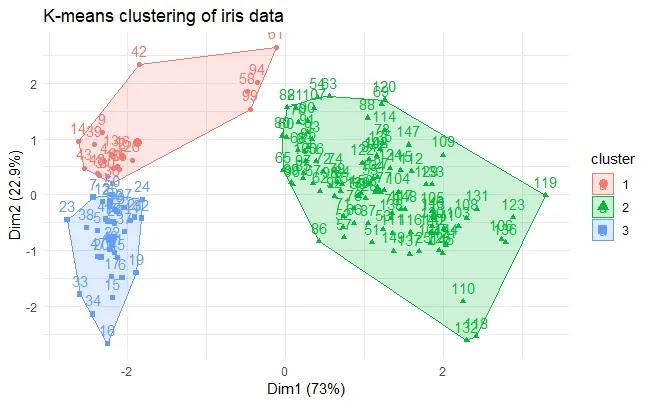
We can see that the clusters are well separated and distinct. We can also see that cluster 3 corresponds to iris virginica, cluster 2 corresponds to iris setosa, and cluster 1 corresponds to iris versicolor.
Interpret and evaluate the clusters
We can use the broom package to extract some information from the clustering results to interpret and evaluate the clusters. For example, we can use the tidy() function to get a summary of the cluster sizes and within-cluster sums of squares (WSS):
# Load broom package
library(broom)
# Get a summary of the cluster sizes and WSS
tidy(km)
At the end of the blog post you can run this code and explore the output
We can see that each cluster has about equal size (50 observations) and WSS (the lower, the better). We can also use the glance() function to get some global statistics about the clustering results, such as a total sum of squares (TSS), the between-cluster sum of squares (BSS), and average silhouette width (ASW):
# Get some global statistics about the clustering results
glance(km)
At the end of the blog post you can run this code and explore the output
We can see that the TSS is 596, the BSS is 454, and the ASW is 0.55. The TSS measures the total variation in the data, the BSS measures the variation between the clusters, and the ASW measures how well each object fits into its cluster.
The higher the BSS and ASW, the lower the TSS and WSS, the better the clustering results.
We can also compare the cluster labels with the actual species labels using a contingency table:
# Create a contingency table of cluster labels and species
labels
table(km$cluster, iris$Species)
At the end of the blog post you can run this code and explore the output
We can see that the k-means algorithm has correctly classified all the setosa flowers but has misclassified some versicolor and virginica flowers.
Overall Accuracy
The Overall accuracy of the clustering results is:
# Compute the overall accuracy of the clustering results
sum(diag(table(km$cluster, iris$Species))) / nrow(iris)
At the end of the blog post you can run this code and explore the output
The overall accuracy is about 89%, which is not bad for an unsupervised learning method.
I hope you have enjoyed this article and learned something new.
FAQs
What is cluster analysis in data mining?
Cluster analysis in data mining groups similar data points based on their features or properties.
Why is cluster analysis in data helpful in mining?
Cluster analysis in data mining is valuable as it helps explore and visualize data, find patterns and insights, detect outliers, reduce data complexity, and simplify analysis.
What are the main types of cluster analysis in data mining?
The main types of cluster analysis in data mining include partitioning, hierarchical, density-based, and model-based methods. Each type has pros and cons, depending on the data and goals.
What are some examples of cluster analysis in data mining applications?
Examples of cluster analysis in data mining applications include customer segmentation, process optimization, image segmentation, and gene expression analysis.
How can I perform cluster analysis in data mining using RStudio?
Here's how to do cluster analysis in data mining using RStudio:
1. Install RStudio on your computer from https://www.rstudiodatalab.com/2023/06/a-comprehensive-guide-to-rstudio.html.
2. Load your data into RStudio using read.csv() or a suitable function for your data format.
3. Choose a clustering method that fits your data type and goals. Use built-in functions like kmeans(), hclust(), or dbscan(), or install packages like cluster, mclust, or dbscan.
4. Apply the clustering method with the proper function and parameters to your data. You can visualize and evaluate the results with the factoextra package.
5. Interpret the clustering results and conclude.
What is k-means clustering, and how does it work?
K-means clustering is a method that divides data into a set number of clusters based on the distance between data points and cluster centers. It works by initializing cluster centers randomly, assigning data points to the nearest cluster center, updating the centers based on the average of assigned points, and repeating until convergence or a maximum number of iterations.
What is hierarchical clustering, and how does it work?
Hierarchical clustering creates a nested hierarchy of clusters based on a data point or cluster similarity. It works by either starting with each data point as a cluster and merging them based on proximity (agglomerative) or starting with all points as one cluster and splitting them based on distance (divisive).
What is DBSCAN, and how does it work?
DBSCAN is a density-based method identifying clusters by data point density in a region. It defines two parameters, epsilon (max distance between neighbors) and minPts (min neighbors to be a core point). It classifies points as core, border, or noise and assigns them to clusters based on connectivity.
How can I evaluate the quality of my clustering results?
You can assess clustering results using internal or external measures. Internal measures use data information, such as within-cluster variation or silhouette coefficient. External measures use information like class labels or expert knowledge to compare results with reference criteria like purity or entropy.
How can I choose the best clustering method for my data?
To select the best clustering method for your data, consider factors like data type, cluster number, presence of noise, computational complexity, and interpretability. You can compare methods using evaluation measures and choose the best suits your goals.
Need a Customized Solution?
Join Our Communities: Telegram
View OutputConclusion
In conclusion, this article provided a solid introduction to cluster analysis in data mining. You understood how this technique groups similar data points together based on their properties. We explored the main types of cluster analysis, including partitioning, hierarchical, density-based, and model-based methods, each with unique advantages and drawbacks.
Furthermore, we delved into real-world applications of cluster analysis, showing its usefulness in various fields such as marketing, business operations, image analysis, and biology. By exploring these applications, you gained insight into the practicality and versatility of this method.
The article also taught you how to perform cluster analysis in RStudio, a popular data analysis tool. With clear steps and guidance, you can now use RStudio to implement different clustering methods and visualize the results for better understanding.
In summary, cluster analysis is a powerful and valuable tool in data mining. It empowers you to extract valuable information, uncover patterns, and gain insights from your data. With this newfound knowledge, you are better equipped to leverage cluster analysis for various data-driven projects and decision-making processes. Happy data mining!
If you want to learn more about cluster analysis in data mining, you can check out these resources:
If you want to learn more about cluster analysis in data mining, you can check out these resources:
- Cluster Analysis in Data Mining | Coursera
- R Blogger
- What Is Cluster Analysis? (Examples + Applications) | Built In
- Cluster Analysis in Data Mining: Applications, Methods
- Clustering in Data Mining - TAE - Tutorial And Example
- What is Clustering in Data Mining? - Machine Learning Pro
If you want to learn more about RStudio and data analysis, you can check out these resources:
Thank you for reading, and happy data Clustering!
